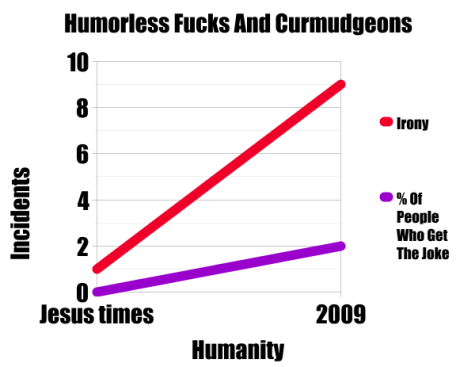
You big dummy!
There is something that I find humorous about the visceral nature of humanity. We give far too much credit to our eyesight for our peace of mind. Seeing is believing, or so they say. Well whatever happened to faith? And our guts? People don’t trust their intestines for anything anymore, but I bet you that a scientist would pull out your innards and tell your life story as if they were reading a papyrus scroll. This is because we lack soul collectively. Stop believing what your eyes are telling your brain.
A few days ago I posted a drop here and at the X spot to talk about the mainstream media’s account on the mortality of the Black male. Now for those of us that are, ummm, Black males, this isn’t any particular news that we haven’t likely experienced in several forms. Even the fact that it appears to have worsened isn’t surprising to us. Sad to say. In the wake of this newsstory I was inspired to create a graph which described the relationship of Black male mortality to the commerce of music that highlights Black male mortality.
The internets went nuts thanks to ProperTalks, but the only thing people focused on was the graph I created. No one wants to deal with the story on how we are all complicit actors in the drama of supremacy. People want to quibble about a gotdamn graph that doesn’t mean shit. This is because people lack soul. Even Black folks. I know that Black folks like to think they inherently have a conscience but CLARENCE THOMAS, CONDOLEEZA RICE and ROBERT JOHNSON are all proof positive that having a soul is nothing that is mutually racially exclusive.
The truth, without the use of a graph or even an article in the supremacist apologist NYTimes is that the Black male is the most marginalized and disenfranchised person on the planet. This maintains the hegemony of supremacy and assists the design of capitalism. This is why we can afford to buy t-shirts at Wal-Mart for $2 and why this country is building prisons faster than they are building schools. 1 out of every 100 Americans is in prison right now.
Do you need a graph for that?

The R3MIX
Proper Talks: NYT Report on Murder Rate of Black Teens is Misleading
The Atlantic: The real problem with black on black crime
MotherJones: Gangsta Rap ≠ Street Violence
Happy New Years dP!
Good stuff here. I was surprised at how many people over at Ta-Nehisi focused on your graph instead of the bigger picture =/
PT,
That was the same story on MotherJones
When people get caught up in graphs and stats coming out of major academic institutions it gets really humorous and dangerous. Humorous because for some it becomes immediate fact even when they don’t know how or who conducted the research, why and was there a hidden agenda behind the information. Dangerous because stats evolve into fact and often sways public opinion and policy.
The thing is your graph is the truth. It didn’t come out of Columbia University or any major accredited institution of higher learning but I’m sure any fan doing the research can easily pull numbers out of the air and make the work with the graph. 2006, that’s just about right.
Facts get skewed often, the Daily Show with Jon Stewart demonstrates that regularly.
“There is no way that graph is accurate.”
– Captain Obvious
I weep.
good read.